


Major legislation in recent years has brought considerable change to the educational landscape in Oklahoma. Last year lawmakers approved a record $625 million in recurring funding for the state’s public schools. Oklahoma also adopted two unique school choice policies in 2023 that have attracted national attention. The first, the Oklahoma Parental Choice Tax Credit Act, offers families a tax credit of up to $7,500 per child for tuition and fees at accredited private schools. The second was the state’s authorization of the nation’s first publicly funded religious charter school—St. Isidore of Seville Catholic Virtual School. Legal battles over the constitutionality of providing public funding for this religious school are underway and eventual court rulings will conceivably have far-reaching implications for American education that go beyond Oklahoma.
Although this year’s legislative session has been more subdued than last year’s, lawmakers are considering pivotal education bills that deal with teacher compensation, the timing of school board elections, restrictions on virtual school days, and the banning of cell phones in classrooms. But what do Oklahomans think about major education issues in the state? Do recent legislative actions reflect the interests of the voting public?
To answer these questions, I am pleased to introduce the Oklahoma Education Journal’s first-ever “Oklahoma Education Poll”. Fielded in early spring of 2024, this annual poll is based on a random sample of 601 Oklahomans who hail from across the state and come from all walks of life. The poll results (based on this sample) have a margin of error of +/-4 percentage points at a 95% confidence level. This margin of error is similar to that of national Gallup polls.
School and State Grades
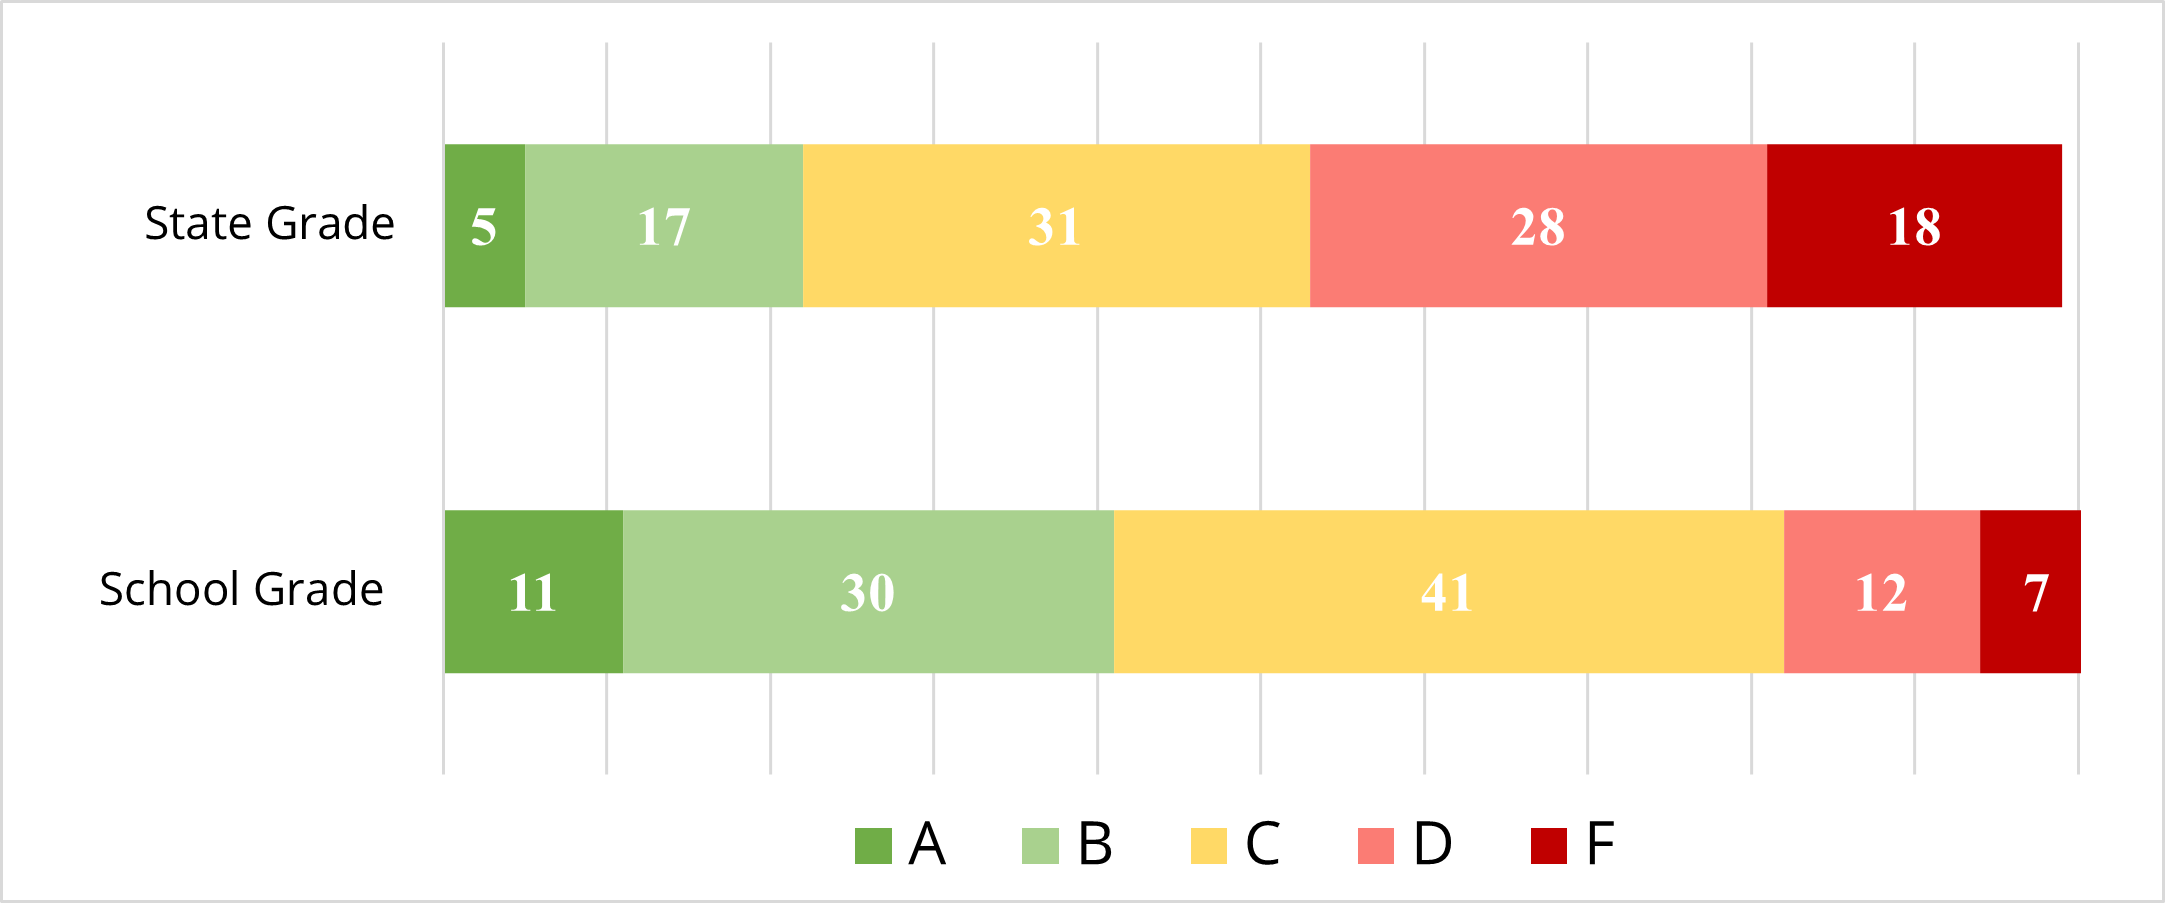
In Oklahoma, the state gives schools grades of A-F based on student achievement levels, academic growth, graduation rates, post-secondary opportunities (e.g. Advanced Placement courses offered), and student attendance. In the Oklahoma Education Poll, respondents were asked what grade they would give public schools in their community. They were also asked what grade they would give the state in managing Oklahoma’s K-12 education system.
In Figure 1, respondents generally held more favorable views of their local schools than they did the state’s management of the K-12 education system. Approximately 41% of respondents gave their local schools an A or B grade, whereas only 22% gave the state an A or B grade. For ratings of the state and local schools, a C grade was given most frequently. These results for grades are largely consistent with those reported in national surveys.
.png)
Funding for Schools and Teachers
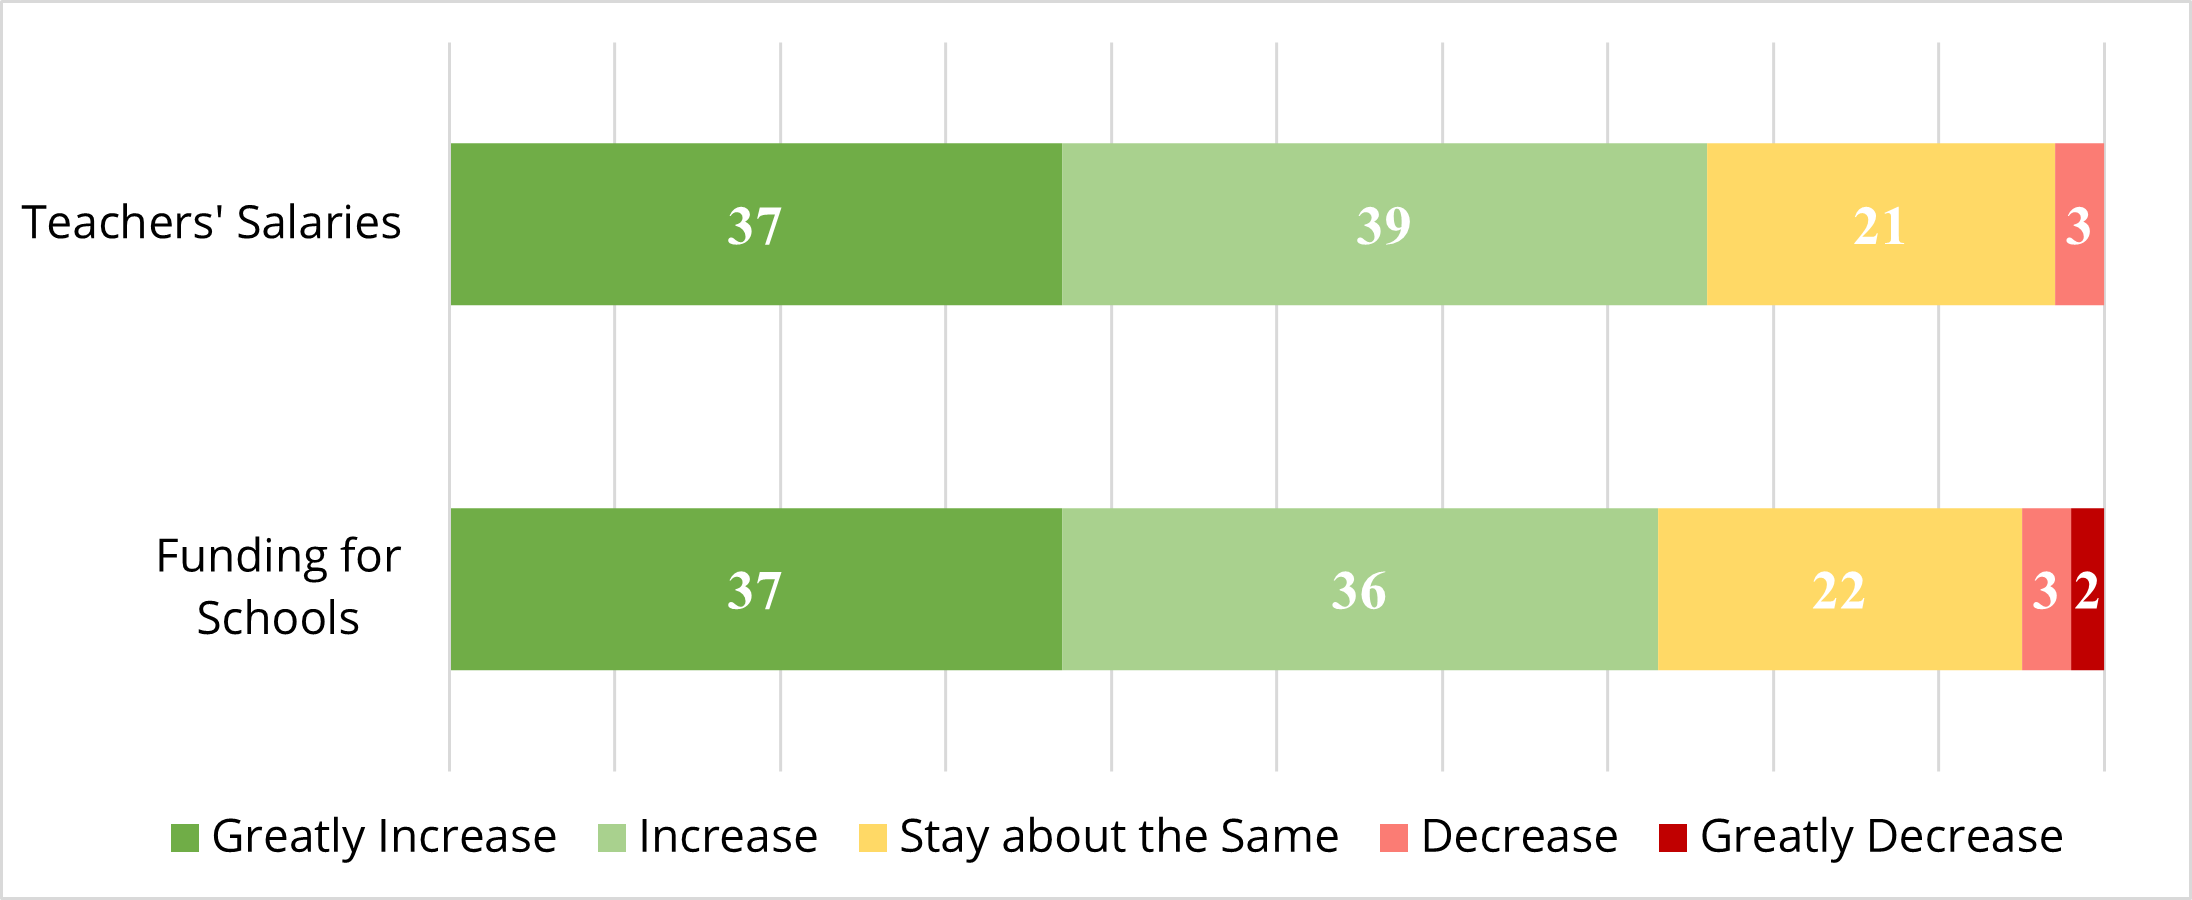
In the poll, respondents were told that public school teachers in Oklahoma are paid an average of $56,000 a year. They were then asked whether they thought teachers’ salaries should increase, decrease, or stay about the same. Respondents were also told that about $13,000 per child was being spent each year on education in Oklahoma’s public schools. They were subsequently asked whether government funding for public schools should increase, decrease, or stay about the same. Figure 2 indicates support for both increasing teachers’ salaries (76%) and raising funding for public schools (73%) in general.
.png)
High-profile Education Issues
Respondents also weighed in on high-profile education policy issues in Oklahoma. In the poll, they were told that Oklahoma passed a law requiring students to use the restrooms or locker rooms that matched the sex listed on their birth certificate. Approximately 74% of respondents expressed support for this law. When asked about banning cell phones in classrooms, most respondents (60%) wished to ban students from using their cell phones in class.
Respondents also offered their views on school district consolidation (i.e., the combining of small districts into one larger district). Most (60%) indicated support for combining small neighboring districts into one larger school district. Interestingly, support was consistent for respondents from small towns and rural areas (56%), small and midsize cities (59%), suburbs (62%), and large cities (63%).
.png)
On public and private school choice, the poll offered respondents short descriptions of charter schools, religious charter schools, and the state’s individual refundable tax-credit for private school tuition and fees. As shown in Figure 3, there is more support for school choice among respondents than there is opposition to it. Charter schools, religious charter schools, and the individual tax-credit for private school tuition and fees all receive more support than opposition to them.
Partisan Division and Agreement
In Figure 4, Democrats and Republicans differ on most education issues. The widest gulf between the two groups is on the state’s law requiring students to use the restroom or locker room that matches the sex listed on their birth certificate. Ninety-two percent of Republicans support this law, but only 35% of Democrats support it. Republicans are 7% more likely to support banning students from using their cell phones in class (61% vs. 54%) and about 5% more likely to support district consolidation (62% vs. 57%). Most Republicans favor the individual refundable tax-credit for private school tuition (56%), charter schools (57%), and religious charter schools (71%) with religious charter schools receiving the most support among Republican respondents. Democrats expressed much less support for school choice, particularly private school choice. Only 33% of Democrats support charter schools and just 18% of Democrats support religious charter schools.
One area where both Democrats and Republicans showed substantial agreement is on funding of schools and salary increases for teachers. More than 90% of Democrats support increases in school funding and teachers’ salaries while 64% of Republicans support increased funding for schools and 72% of Republicans support increasing teachers’ salaries.
_indicating_support_by_political_party.png)
Views of Parents
In Figure 5, parents/guardians with children in the K-12 education system are compared to respondents without children in the school system. With some differences, both groups of respondents expressed largely similar views. Parents/guardians were more likely to support charter schools and religious charter schools as well as restrictions on restroom or locker room use based on the sex listed on a student’s birth certificate. Parents/guardians were also about 7% more in favor of increased funding for public schools than non-parents were.
_indicating_support_by_parent_guardians_vs._non-parents_guardians.png)
Conclusion
In this inaugural Oklahoma Education Poll, the results showed some surprises. One was on the issue of school district consolidation. District consolidation has been a contentious issue in Oklahoma’s rural areas where critics have argued that district consolidation leads to the economic and social decline of small towns. In the poll, respondents were more likely to support district consolidation (60% support vs. 30% opposition). What’s more, support was almost as strong for respondents residing in small towns and rural areas as it was for respondents residing in cities and suburbs.
Another unexpected result was that both parents/guardians and non-parent/guardians held similar views on raising school funding and teachers’ salaries. This finding challenges the prevailing notion that individuals without children in the school system are far less inclined to support educational spending increases. It may also underscore an underlying sentiment among Oklahomans that education is an investment not only in the individual student but also in the broader community.
In the poll, partisan differences between Democrats and Republicans on school choice were not surprising, but the extent of the divide between these two groups in Oklahoma exceeds trends observed in national polls on school choice issues. For Republicans, restricting the use of school bathrooms and locker rooms based on the sex listed on a student’s birth certificate is a unifying issue with an overwhelming majority being strongly in favor of this law. By contrast, Democrats have a less cohesive stance. More than one-third of Democrats support the law.
Looking ahead, the Oklahoma Education Poll will continue to monitor respondents’ views of the issues presented in this article as well as new issues of significance in next year’s annual poll.
Poll Design and Methods
This poll was sponsored by the THRIVE Center at the University of Oklahoma. It was administered in March of 2024. To obtain the sample, Random Digit Dialing (RDD) was performed by using a sample frame of 21,512 cell phone numbers gathered from cellular base stations in every part of the state. In the poll, 28% of respondents reside in large cities, 13% reside in small/midsize cities, 22% reside in suburbs, and 37% reside in small town/rural areas. The sample consisted of 601 respondents. Based on this sample, the poll results have a margin of error of +/-4 percentage points at a 95% confidence level.
The main findings from the full sample offer a representative sample of Oklahomans (age 18 years and older). Post-stratification population weights were used to adjust the survey sample for non-response bias. The weights used for the full sample ensure that the demographic characteristics of the analytic sample match the characteristics of the adult population (18 and over) in Oklahoma. Responses were weighted based on the following characteristics: foreign-born status, racial/ethnic background, education level, age, political preference, parent/guardian status, and sex. Population data were drawn from the US Census Bureau’s American Community Survey.
For sub-group analyses (e.g., Republican vs. Democrat respondents), results do not have the same level of representativeness as the full survey sample with population weights. The results presented for subgroups within the sample have larger margins of error depending on the sub-sample size. Therefore, caution is warranted when interpreting the results of the sub-group analyses. For the results presented in figures, percentage totals do not always add to 100 because of rounding to the nearest percentage point.
Author Bio
Daniel Hamlin is Associate Professor of Education Policy and Research Director of the THRIVE Center at the University of Oklahoma.
